


Imagine investing 1M€ in TV advertising. Common sense might suggest this investment will generate twice as much impact as 500k€. However, marketers understand that this is rarely the case: from a certain investment level, every euro generates less than the previous one. This phenomenon is called the law of diminishing returns, and is at the heart of Marketing Mix Modeling (MMM).
In MMM, diminishing returns are modeled by saturation functions, which highlight the fact that the incremental revenue of media channels slows down as budgets increase. Knowing the point at which additional spending becomes less effective is therefore fundamental to guiding strategic budget allocation decisions.
This is exactly what Meridian enables. By estimating the saturation dynamics of each media channel, Meridian provides both a retrospective view of media performance and a forward-looking foundation for scenario-based budget planning. Below, we will explore how Meridian models the saturation, how it represents it through two complementary visualizations, and to what extent these saturation results are used to provide a robust prediction of the budget allocation.
The saturation phenomenon is modeled by the Hill function. This function takes as input a media performance and returns an impact percentage on a specific target, like total revenue (in practice, inputs are pre-processed through transformations such as scaling and adstocking, but for clarity’s sake, we will focus on the function itself). In other words, a key performance indicator specific to the media channel (e.g., impressions, clicks, GRP), noted x is provided to the function, and the percentage impact is built according to the following formula: xsxs + ecs
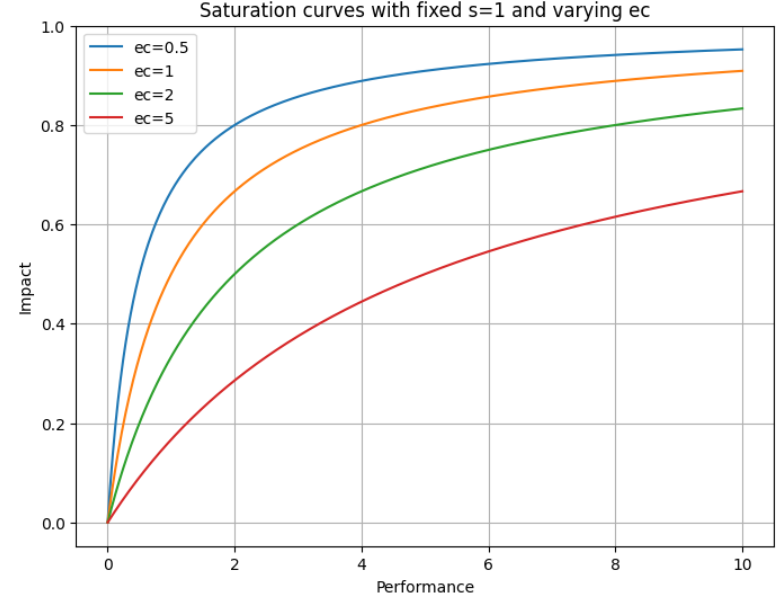
This function depends on two parameters, calibrated by Meridian: ec and s. First, ec represents the level at which impact reaches 50%, often interpreted as the media channel’s half-life.
In the next figure, the x-axis represents media performance (e.g., impressions, clicks, GRP, already scaled and adstocked) while the y-axis corresponds to the modeled impact. The different curves illustrate how the half-life ec shapes the saturation. For a constant s parameter, a low value of ec (blue curve) means that the channel quickly reaches saturation: after a performance of 4, additional investment barely increases impact. On the opposite side, a high value of ec (red curve) indicates that saturation is reached later, but the curve grows more slowly.
Second, the next figures show that saturation curves can have two different shapes:
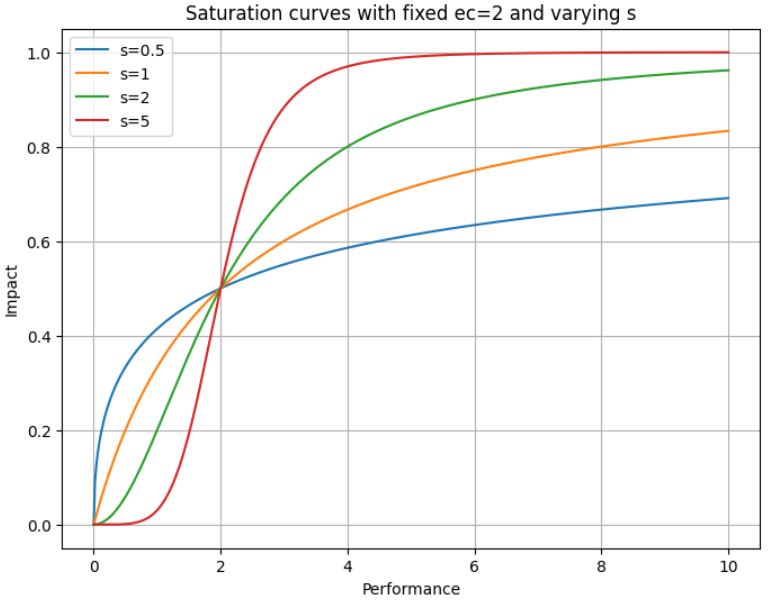
This difference of channel behaviours is captured by the s parameter: if s 1, saturation is modeled as a C-curve, otherwise, as an S-curve.
This mathematical nuance has a clear business meaning: some channels are more likely to deliver strong returns at low investments, while others require a minimal spend before a significant impact.
Thus, modeling the saturation is equivalent to calibrating ec and s. For that purpose, Meridian relies on a combination of two sources of knowledge:
These two inputs allow Meridian to update the distributions of ec and s: the resulting calibrated distributions are called posteriors. In practice, this means business hypotheses are refined with observed data, turning priors into calibrated posteriors.
After having computed the posteriors, Meridian can display the saturation curves for each channel.

This output from Meridian represents the saturation functions for each channel. The red and blue curves correspond to the priors and posteriors, respectively, and the strips surrounding the curves correspond to their respective confidence intervals. The histograms in the background represent the distribution of historical data, showing how the model learns from past data.
This allows us to compare not only the modeled saturation but also how actual investments are positioned relative to these curves. For example, channel 4 shows a distribution that is approximately Gaussian and centered around the good performance area. However, a significant part of the investment is located in the saturation region, where the marginal ROI is very low. This suggests that reallocating some of this budget to other channels could improve efficiency. Conversely, channel 0 or channel 3 show no investment in the saturation zone: most of the budget has been allocated to the high marginal ROI area.
In business terms, these curves quantify for each channel the impact brought by a certain quantity of media performance (e.g., clicks, impressions, GRP,...). Concretely, it answers the question: at each step date, how does media exposure translate into relative impact on the target KPI?
Consequently, these graphs integrate a temporal dimension by measuring the impact on each step date.
However, for decision-makers, these graphs have two main limitations:
As a result, these saturation curves provide a first diagnostic and a technical view of how each channel behaves, but are less exploitable for strategic budget discussions.
To remedy this, Meridian also provides response curves, which translate the same dynamics into business metrics. These response curves use posteriors to plot for each channel the incremental revenue as a function of total spend.
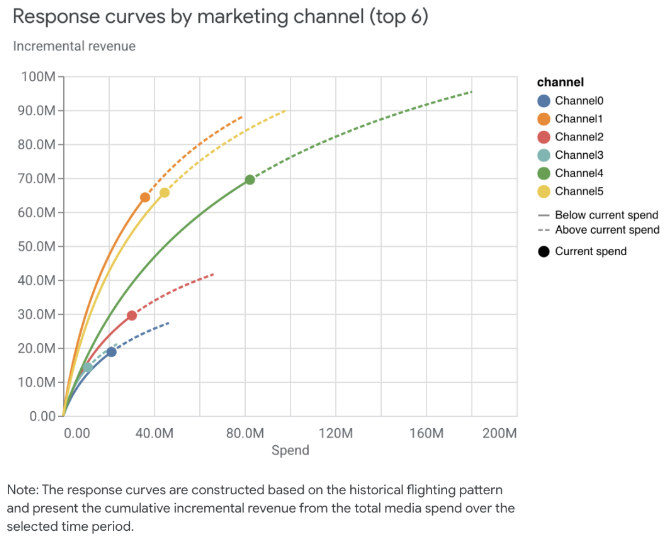
To plot these graphs, Meridian uses posteriors to convert impact percentages into incremental revenues. Posteriors are also converted from media performance into spend through simple transformation rules, which enables Meridian to plot the entire curve.
Thus, the two previous limitations are bypassed: the two axes translate business indicators, and spending levels are directly interpretable for marketers, which makes them directly actionable for budget planning. However, these curves are based on total media spend over the whole time series, meaning the temporal dimension is not represented.
That is why the two visualizations are complementary rather than substitutes: the first one provides a temporal diagnostic, while the second one offers a forward-looking business view. Both of them are also used by the Meridian budget optimizer, introduced in the next section.
Saturation and response curves provide an analytical foundation, but their real values come with the Meridian Optimizer. This module proposes the best budget allocation according to different specified scenarios, making it a powerful tool for budget planning.
A first use case could be the following: “How can we better allocate our current media budget?”. This use case consists of obtaining a new optimized distribution of the current budget, called ‘fixed budget scenario’ in Meridian. To answer that, Meridian uses its previous learnings to propose an optimal allocation.
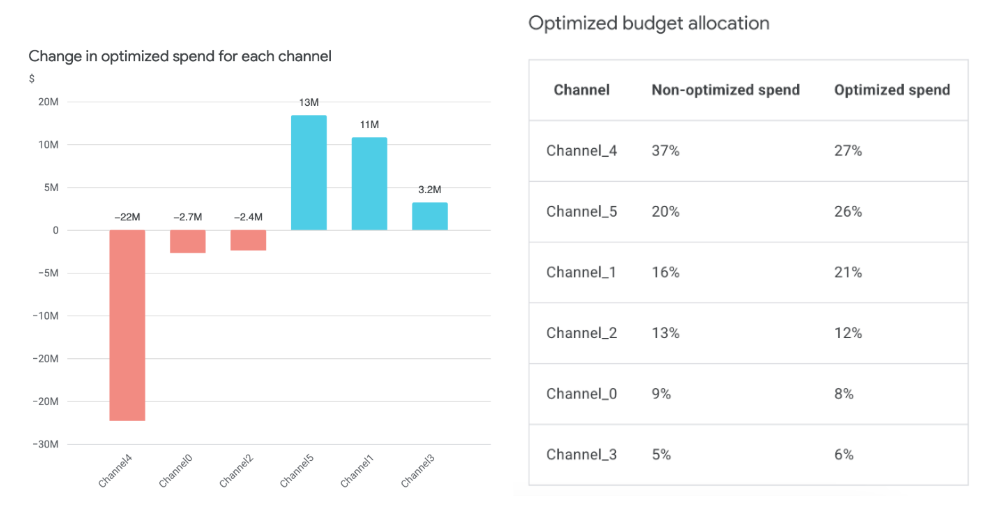
Note that the sum of the changes is zero. In fact, in a fixed budget scenario, total spend is preserved: some channels increase, others decrease. In a ‘flexible budget scenario’, total spend may change to reach a specified target ROI.
Another use case could be the following: “How can I control the optimization results?”. Meridian includes the possibility of applying constraints on media channel budgets. In the configuration, it is possible to impose the fact that TV spend must not exceed 120% of historical levels, or Search must receive at least 15% of the budget, for example.
Finally, even with a constant budget, spending can be invested in different ways. For example, should you invest steadily over time, or concentrate spending on shorter high-intensity bursts? The same budget does not mean the same impact, and the Meridian optimizer can examine the different options: it also supports different flighting strategies to find the best way to spend the media budget over time.
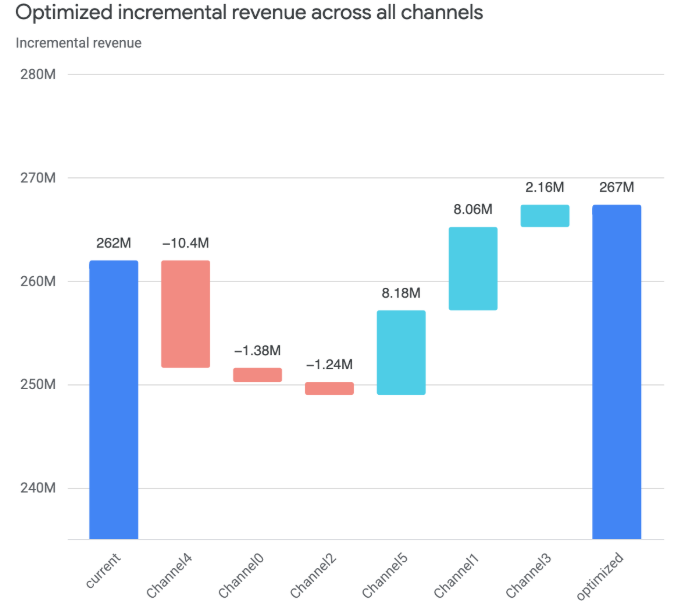
However, not all optimizations lead to higher returns, as evidenced by the next figure. This is an output of the Meridian optimizer, which shows us that despite optimization, some channels see a drop in incremental revenue. That reinforces the idea that Meridian is an assistance tool: reallocating budget can have consequences for several media channels, and quantification of risks related to this potential reallocation is always needed.
Meridian allows for leveraging complementary saturation views to propose a forward-looking budget allocation across different scenarios (fixed budget, flexible budget, media budget constraints, temporal flighting pattern). This complete approach enables decision makers to capitalize on historical performance to make the best choice at the right time for the future.
However, a careful configuration is required to achieve this optimal allocation, from prior specification to scenario design. A business view is also needed afterwards, to challenge optimizer results and to take the best decision according to real market constraints. A dual expertise, technical and business, is necessary for this type of project: models guide, but humans decide.

Discover all the latest news, articles, webinar replays and fifty-five events in our monthly newsletter, Tea O'Clock.


-min.jpg)


